The debate about sex/gender 1 in the brain continues with urgency in Western countries. 2 For one example, in 2014 the National Institute of Health (NIH) began to require that scientists examine and report differences between female and male animals in all preclinical trials (Clayton and Collins 2014). For another, in 2017 the Journal of Neuroscience Research published a nearly 800-page special issue on sex/gender influences on nervous system function with more than seventy invited contributions. Nota bene there was no open call for this issue 3 , restricting the content to articles by authors whose understanding of sex/gender is deeply rooted in the belief of the existence of fundamental differences between women’s and men’s brains (for a constructive commentary, see Rippon et al. 2017). Per the editor-in-chief of that issue, “sex matters not only at the macroscopic level, where male and female brains have been found to differ in size and connectivity, but at the microscopic level too” (Prager 2017, 11) and, echoing Cahill (2006), to ignore “sex as a biological variable” would be to leave the scientific community with “major gaps in knowledge.” Hence, the journal requires that “the inability for any reason to study sex differences where they may exist should be discussed as a study limitation” and that “manuscripts reporting exploratory analyses of potential sex differences in studies not explicitly designed to address them are encouraged” (Prager 2017, 11). The latter policy increases the probability of false positive findings (Rippon et al. 2017) but, according to the editor-in-chief, such risk is balanced by the perils of failing to find differences. In other words, when it comes to sex differences, false positives are preferred to false negatives. Even authors of underpowered studies are now welcome to run and report on exploratory sex/gender analyses.
This example shows how challenging the status quo (in this case, the preponderance of studies on male animals) relies not on doing more rigorous science, but rather on doing riskier analyses. Of additional concern, the Journal of Neuroscience Research policy does not call for the inclusion of effect size analyses, which have been adopted as standard by other scientific societies and journals (e.g., Psychological Science, Eich 2014; the APA Task Force on Statistical Inference, Wilkinson 1999). As p-values do not provide information about the strength of a relationship and given that even very small group differences can be associated with statistically significant p-values in studies that employ very large samples, this failure to require the inclusion of effect size analyses can inundate the field with differences of little to no relevance or importance (Calin-Jageman and Cumming 2018).
This debate raises many questions. Broadly, why is there a renewed interest in sex/gender difference in neuroscience research? Why might a scientist consider it riskier to report a failure to find differences than to disseminate findings that have poor chances of replication? Why might a journal editor require nearly all neuroscientific papers to measure “sex as a biological variable,” and so implicitly privilege sex over other biological variables, regardless of the goal of the study in question?
Feminist scientists have already started to tackle these and other questions pertaining to the neuroscience of sex/gender (e.g., Fausto-Sterling 2000; Kaiser et al. 2009; Roy 2012; Fine 2010a, 2010b; Jordan-Young 2010; Kuria 2012; Joel 2012; Rippon et al. 2014; Bluhm 2013; Schmitz and Höppner 2014; Rippon et al. 2017; Maney 2015). Their approaches have been inspired by feminist science and technology studies, which aim to identify and interrogate pretheoretical assumptions regarding sex/gender (e.g., equation of femaleness with passivity, assumption of male-typical traits and behaviors as normative or superior, the notion that biological sex determines social expressions and institutional arrangements of gender, and the assumption that sex/gender generally sorts bodies and behavior into only two dimorphic groups). The work of feminist neuroscientists is driven by a commitment to scientific rigor, not a commitment to a particular ideology. Their critique has focused on issues of statistics, measurement, methodology, and replication; it has offered alternative explanations and contributed to new interpretations of empirical neuroscientific data (e.g., Joel et al. 2015; Joel and Fausto-Sterling 2016; Kaiser et al. 2009; Fausto-Sterling 2005a, 2005b; Fine 2013; van Anders and Watson 2006; Joel et al. 2018; Rippon et al. 2017). In a nutshell, by critically analyzing the field’s dominant assumptions, theories, and practices, feminist scientists call for more rigorous science. We, as feminist scientists, see our work situated in this tradition.
This paper contributes to this field first by reviewing some outstanding issues pertaining to the question of sex/gender in the human brain, with a special focus on neuroimaging data; second by proposing several methodological interventions for more accurately interrogating sex/gender differences; and third by applying these interventions to an examination of similarities and differences between women and men in major white matter tracts using diffusion MRI (dMRI) data from a publicly available neuroimaging dataset. The interventions we describe and apply here include running empirical tests of randomization control and permutation analyses to protect against false positives, calculating measures of both difference (i.e., effect size) and overlap/similarity between groups, and reporting null results. Lastly, we discuss our findings and implications for study design with the aim to create a template for greater transparency in sex/gender neuroscience.
1. Sex/Gender and the Brain: Some Outstanding Issues
1.1 Stagnation
At risk of being reproached for adopting a positivistic attitude, empirical sciences show progression in terms of the questions that are asked and the knowledge that is generated. That is, new findings typically complicate existing knowledge. For instance, within genetics, the central dogma has been replaced by more interactive models of gene functioning; concepts like epigenetics, now familiar, have broadened our understanding of developmental processes and generational effects (e.g., Champagne 2013; Gottlieb 1998). In neuroscience, the static view of the brain has yielded to new models of brain functioning based on evidence that the brain changes with experience (e.g., Zatorre, Fields, and Johansen-Berg 2012; May 2011; Livingston 1966). However, sex/gender neuroscience in structural or functional neuroimaging lacks this type of progress. The field does not seem to have moved beyond the question, “Is there a difference between women and men in …?” (for a similar argument regarding medical research broadly, see Springer, Mager Stellman, and Jordan-Young 2012). The inevitability of addressing the sex/gender question by these means, and only in this manner, reveals the field’s real stagnation. For example, the persistent question of whether parts of the corpus callosum differ between women and men, which has been accompanying us for over thirty years now (DeLacoste-Utamsing and Holloway 1982; Holloway 2017), might be one of the reasons we have, in Prager’s (2017) words, “major gaps in knowledge.” This constricted way of asking keeps us caught in a fixation on differences, a neglect of variability, a neglect of covariates, and a failure to adequately consider the role of experience, broadly defined, and the complexity of developmental processes. 4
Such stagnation is often reflected in publications’ introductions. For example, in a study that investigated sex differences in gray matter in areas important to language production (Kurth, Jancke, and Luders 2017), the authors provide selected information about alleged psycholinguistic, behavioral, structural, and functional sex/gender differences in language processing embedded in the “sexual dimorphism” frame. The authors’ approach is similar to that in the first fMRI neurolinguistic study of sex/gender differences, published over twenty years ago (Shaywitz et al. 1995). They do not attempt to draw a new theoretical picture, let alone use a gender studies-informed approach. The impression is that the research on sex/gender difference in the brain of the last thirty years has stagnated because only the dependent variable (what aspect of brain structure or functioning is considered) has changed as a function of new methods, rather than the question or the “independent variable” of interest (sex/gender).
1.2 Inconsistent Results that We “Know for Sure”
Scientific literature on female and male brains evokes images and notions of profound and substantial difference, as if the two types of brain were drawn from two different populations instead of from a single heterogeneous one (Joel and Fausto-Sterling 2016). In this view, sex is seen as a fundamental organizing variable in biology and neuroscience, one that defines the identity of individual cells (e.g., Vawter et al. 2004; Pardue and Wizemann 2001), shapes the brain’s structure and functioning, and influences or even determines human behavior. Sex as a biological variable is typically considered to exist in a dichotomous form (female, male) and to be characterized by nonoverlapping profiles. The frequent use of “sexual dimorphism” in studies of human brains (e.g., Cahill 2006; Gilmore et al. 2007; Goldstein et al. 2001; Kurth et al., 2017; Nopoulos et al. 2000) reinforces this conception (Joel 2012; Jordan-Young 2014). However, research on sex/gender reveals something much more complex.
One of the most frequently cited sex/gender differences is that in gray matter and white matter volumes between women and men. This difference, however, is only valid when appropriate statistical corrections for body size are applied, which is not always the case (Rippon et al. 2014). In addition, when such corrections are applied, their metrics are inconsistent between studies on covariates such as height, body mass, and intracranial volume. The choice of metric affects the results; for example, height-based covariates have yielded higher average gray and white matter volumes for men (van der Linden, Dunkel, and Madison 2017), while intracranial volume covariates have yielded differences only in gray matter, with women having a larger proportion on average (Leonard et al. 2008). However, even when measurements are covaried within a single metric, for example intracranial volume, we see reports of higher gray matter volumes in women (Leonard et al. 2008; Gur et al. 1999), men (Good et al. 2001), or no difference (Courchesne et al. 2000; Blatter et al. 1995). These inconsistencies indicate both a replication problem and a methodological disagreement within the field (Jäncke et al. 2015; Hänggi 2011; Nordenskjöld et al. 2015).
Other quantitative differences between women and men have been found to be very small (e.g., Kurth et al., 2017, figure 3; Shiino et al. 2017, figure 1) or inconsistent across studies and time (e.g., Maney 2016). Often, sex/gender differences initially found with a new methodology have not been replicated or have disappeared in later meta-analysis studies. For example, early studies suggested that the posterior portion of the corpus callosum (the splenium) is thicker in women than men (DeLacoste-Utamsing and Holloway 1982; Driesen and Raz 1995), while later studies and meta-analyses failed to corroborate such difference (Bishop and Wahlsten 1997; Jäncke et al. 1997). Similarly, sex differences in lateralization for linguistic functions (e.g., Shaywitz et al. 1995) were not replicated (Ihnen et al. 2009; see meta-analyses by Sommer et al. 2008; Sommer et al. 2004). Other recent meta-analyses found that the amygdala (Marwha, Halari, and Eliot 2017) and the hippocampus (Tan et al. 2016) are not sexually dimorphic as previously claimed. 5
An additional issue pertains to the interpretation of a sex difference, when it is found. As sex/gender correlates with other variables, the presence of a sex/gender effect might reflect the contribution of other factors or confounding variables (e.g., Rippon et al. 2014; Springer, Mager Stellman, and Jordan-Young 2012; Rippon et al. 2017). For example, Duprez and colleagues (2009) found that sex differences in arterial elasticity (a reduction in which marks an increased risk for cardiovascular diseases) were almost completely accounted for by height differences between women and men. Stress can also be a potential confounder of sex. Joel (2011) points out, based on a study by Shors et al. (2001), that while acute stress in adult rats reversed sex differences in apical dendritic spines of pyramidal neurons of the CA1 in the hippocampus, it caused sex differences to emerge in basal dendritic spines of the CA1 and had no effects in other areas. It is clear that controlling for additional variables such as socioeconomic status, occupational status, and cultural background, as well as sex/gender socialization, must be included in sex/gender analyses of the brain.
Certainly, the problem of replication is not isolated to studies of sex/gender and neuroscience. Ioannidis (2005) argues that scientific fields that are especially vulnerable to poor replication rates include those that have great flexibility in methodological options, those that are hot topics, and those in which investigators’ prejudices may influence the studies that are funded and the findings. All these traits arguably characterize studies that examine sex/gender and the brain. Additionally, before the era of brain imaging, cognitive experimental research – the predecessor of cognitive brain imaging – was usually based on a series of three or four experiments that tested a group of related hypotheses on a single topic and were published together. This reasonable, programmatic, investigative approach is not being pursued in cognitive brain imaging, in which what is missing is not only replication research but also the tradition of robustly testing a hypothesis by developing several interrelated experiments to interrogate the variable of interest.
Given all these issues, it becomes clear how inconsistent the neuroscientific results on sex/gender are likely to be.
1.3 Variability and Categorical Grouping into Women and Men
The lack of consistent sex/gender differences across studies and techniques forces us to ask what sort of organizing force dichotomous sex/gender factor might be on brain structure and function. Jordan-Young (2010) argues that a single variable cannot drive the organization of a complex system; furthermore, it is problematic to understand this variable as dichotomous. Indeed, recent work by Joel and colleagues (2015; 2018) suggests a mosaic model has greater explanatory power for understanding the relationship between sex/gender and brain organization. As a remedy to the problem of dichotomy, feminist scientists have invited us to pay more attention to intra-sex/gender variability and inter-sex/gender overlap, rather than using sex/gender as a dichotomous variable, in order to elucidate the relationship between sex/gender and the research question in interest with greater depth and precision (e.g., Nelson 2015).
The application of variability measurements, however, does not erase the problem of dichotomization inherent in sex/gender research. If we design, in theory, a study to examine ” sex/gender variability,” we encounter, in practice, the problem that we place all individual subjects not into one group but instead into groups of women and men, and we then examine the variabilities of those groups. By doing so, we equate sex/gender variability with the comparison of “variability in the group of women” as opposed to the “variability in the group of men” (see figure 1, where green distribution in the first row depicts sex/gender variability in theory, and green distribution in the second row depicts the two variabilities in practice). The entwinement of sex/gender variability with an underlying implication of categorical classification leads unintentionally to a question of intra- or inter-group female/male (F/M) difference. Once here, whether the differences between variability measurements may become “statistically significant” is nearly moot because the variable of interest has been, once again, binarized. The chance to classify sex/gender beyond dichotomy has already been missed.
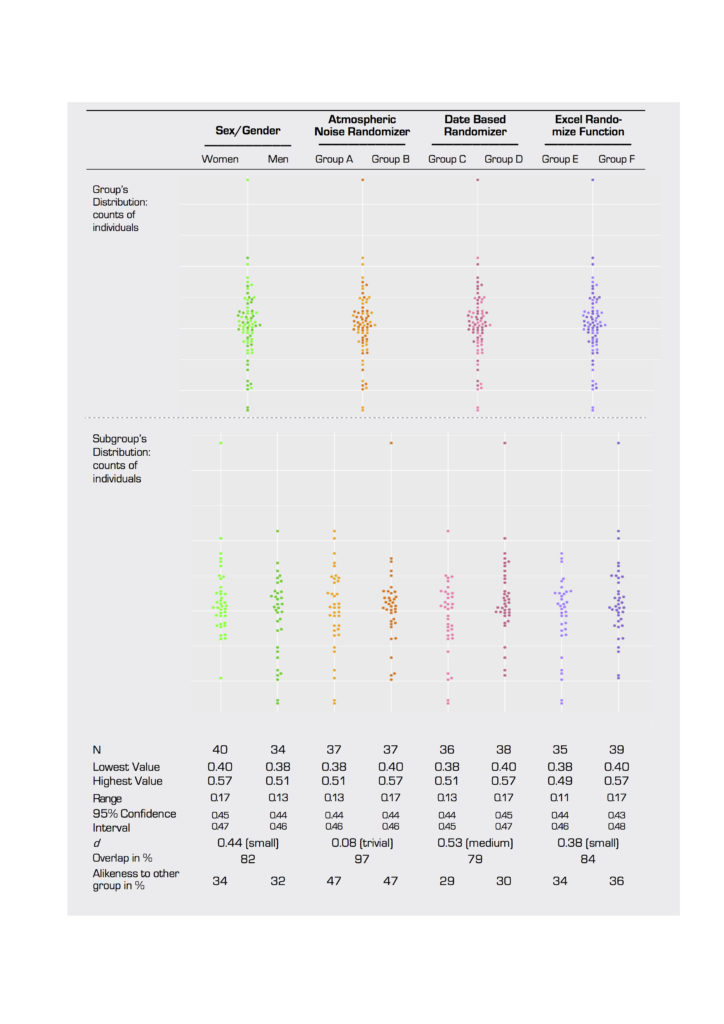
chart (variability in practice).
For these reasons, variability measurements while important, cannot fully address the problem of dichotomization in research questions that examine the role of sex/gender. In the case study presented in 2.2, we, too, began to interrogate variability with available neuroimaging tools but still found ourselves comparing the sex/gender groups. Initially, we aimed to capture structural variability that is lost in traditional neuroimaging analyses. This goal partially changed as we created this paper and evaluated the data. The question at stake that still needs a statistical and methodological answer is: What exactly is the relation between variability and categorizing into groups? In the meantime, in order to produce the most precise and least reductive data possible, we recommend that neuroscientists and other scientists who examine sex/gender as a variable should adopt measures of variability such as range, confidence intervals, and overlap (see figure 1).
For these reasons, and because (1) feminist neuroscientific approaches and feminist interventions are still being created; (2) for some research questions, grouping individuals into sex/gender categories is important; and (3) we are not ready to propose a solid alternative measurement to comparing women and men, our transitional aim is to guarantee that researchers who adopt a classical female-male comparison approach do it in the most informative and useful way, as Fausto-Sterling and Joel (2014) also suggest.
In the next section, we introduce previously elaborated approaches of variability and comparisons of men and women in sex/gender neuroscience by describing effect size and measures of overlap and similarity (2.1.1), and by reiterating the importance of publishing null results (2.1.2). We then further describe strategies by presenting the importance of randomization control (2.1.3) and permutation analyses (2.1.4).
2. Feminist Methodological Interventions: Feminist Tools
In line with feminist empiricism (Harding 1992) and in line with feminist scientists of neuroscience (see above), here we address the question of which empirical strategies should be used to enhance scientific rigor in sex/gender studies (Joel and Fausto-Sterling 2016; Joel and McCarthy 2017; Nelson 2015; Rippon et al. 2017; Vidal and Marchant 2016). What exactly do we mean by “feminist interventions”? Helen Longino (1987, 62) describes the term “intervention” in the context of scientific practice and feminism as “science done by feminists as feminists.” Longino envisions these interventions to be local (field-specific) and continuous with existing scientific work. Here, informed by feminist science and technology studies, we describe and operationalize a series of methodological practices for neuroimaging researchers who interrogate questions of sex/gender. Therefore, as other feminist scientists have done (Giordano 2014; Israel and Sachs 2013), we use “interventions” to describe the practical methodological importance of these empirical strategies.
As stated in the introduction, we claim that to opt for a standpoint of feminist (neuro)science (Haraway 1988; 1991), that is, to examine our neuroscientific questions through the lenses of feminism, does not restrict our research but expands and enriches it by adding a new stream of knowledge-making (Fine 2018). When neuroscientists ask sex/gender questions, it is even more critical to bring feminist knowledge production into the fold. For these reasons, we argue that feminist interventions make for increased rigor and accuracy in the production of neuroscientific knowledge.
In what follows, we describe, elaborate on, and apply analyses and strategies that other empirical neurofeminists have proposed to adopt in sex/gender difference research. For the purpose of this paper, we term these tools “feminist interventions.” We hope to show that the feminist interventions presented here continue to reveal a more complex sex/gender narrative, one that does not speak of two distinct types of brain. First, we describe these interventions (2.1); then, we implement these interventions in a case study (2.2).
2.1 Interventions
2.1.1 Effect Size and Measures of Overlap and Similarity
Effect sizes. Effect sizes constitute a family of descriptive measures that provide information about the strength of the relationship between two variables. (Such information is not provided by significance levels, which indicate the probability that a certain difference is observed by chance.) When researchers compare the means from two independent groups, as typically in the sex/gender difference literature, they most frequently use Cohen’s d measure, in which the difference between the two means is standardized, that is, divided by the standard deviation of the two samples. The standardization procedure allows them to compare data from different studies that employ different sample sizes, as typically done in meta-analyses. In bivariate correlational analyses, the effect size can be measured by squaring the correlation coefficient, r. The coefficient of determination (r2, whose range varies between 0 and 1) is interpreted as the percentage of variance in one variable that is explained, or predicted, by the other variable. High correlation and determination coefficients indicate that a strong relationship exists between two variables, that is, changes in one set of scores predict changes in the other set of scores (low value coefficients indicate a weak relationship and therefore low predictability). For example, the coefficient of correlation between reading and spelling scores can be as high as r=0.92 (Grossi et al. 2001). In this case, 85 percent of the variability in the data is explained by their relationship.
As mentioned earlier and elsewhere (Fine 2010b; Rippon et al. 2014; Hyde 2005), it is critical to include information on effect size, not just significance values, to provide a more reliable picture of the relationship between variables, which is typically the focus in psychological and medical research. Let’s consider an example, one Sullivan and Feinn (2012) discuss pertaining to the Physicians Health Study on whether aspirin prevents heart attacks. In a meta-analysis of various randomized trials, more than 22,000 subjects were tested over an average of five years. The effect of aspirin on a reduction in myocardial infarction yielded a significant p value (p<0.05). Given this result, the authors report that the study was terminated early and aspirin was recommended as a preventive measure (2012, 280). However, the effect was extremely weak, as the effect size (r2=0.001) revealed. Such weakness is also evident if we plot the distributions of data regarding those who took aspirin and those who did not take it (figure 2): the two distributions greatly overlap, showing similar scores for the vast majority of individuals. 6
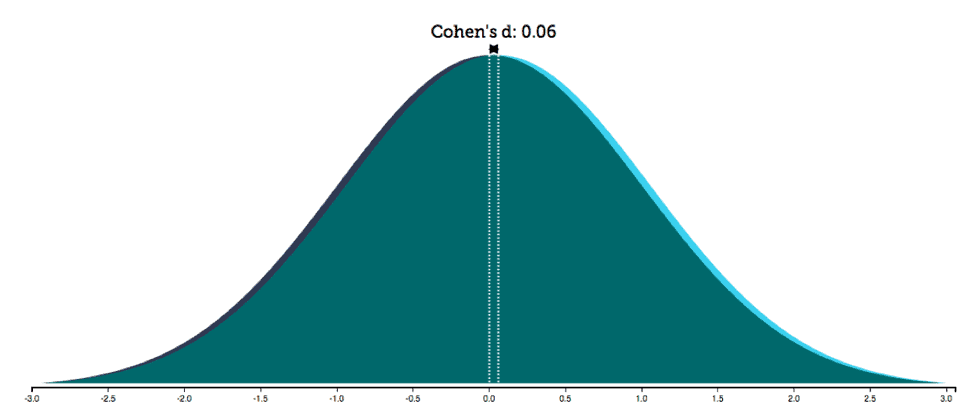
Overlap. The degree of overlap between two distributions can be measured by a family of overlap coefficients, such as Weitzman’s ?. 7 Weitzman’s overlap coefficient is a measure of the area under two distributions simultaneously and therefore of the similarity between two distributions (Inman and Bradley 1989; Weitzman 1970). The overlap between the two distributions in the study Sullivan and Feinn (2012) discuss was 98 percent, which meant that taking aspirin did not have an effect for a vast majority of people. This and other examples clearly show that the presence of a statistical difference does not provide information on the size of the difference; furthermore, it does not translate into two populations that are qualitatively different in terms of their properties, characteristics, or forms – the proper meaning of “dimorphism.”
Nonetheless, considerable overlap is often interpreted as reflecting sexual dimorphism in neuroscience. For example, their paper “Sexual Dimorphism in Broca’s Area,” Kurth et al. (2017) describe sex differences in Broca’s area (BA44 and BA45) in a sample of fifty women and fifty men. Although the authors found no differences in lateralization between the sexes/genders (they had predicted lateralization differences, which would explain the purported superiority of women in language-related tasks), they found gray matter to be larger for women than men in both hemispheres, as indicated by statistically significant p values for the four comparisons (BA44 left, BA44 right, BA45 left, and BA45 right). The authors describe these differences as reflecting dimorphic structures. However, we computed effect sizes based on the average volumes and standard deviations provided by the authors in their table 1. The results reveal small effect sizes and a high degree of overlap for the four regions: BA44 left, Cohen’s d=0.21, 90 percent overlap; BA45 left, d=0.30, 88 percent overlap; BA44 right, d=0.22, 91 percent overlap; BA45 right, d=0.28, 88 percent overlap. It is difficult to argue that these data reflect dimorphism. For example, even taking the largest effect size in the study (0.3), 42 percent of men were more “woman-like” than the average woman in terms of gray matter volume in these areas. The same was true for women with respect to men. In terms of overlap, forty-four out of fifty participants in one group had scores that overlapped with those of participants in the other group (88 percent).
A high degree of overlap is typical when we consider psychological variables. Hyde (2005) summarizes sex/gender differences investigated for 124 variables, pertaining to domains such as cognition, communication, motor behaviors, social and personality, and well-being, based on available meta-analyses (see their table 1). Only two variables (2 percent) were associated with effect sizes larger than 1, that is, throwing distance (d=1.98, 32 percent overlap) and throwing velocity (d=2.18, 27.6 percent overlap); 30 percent of the variables yielded effect sizes between 0 and 0.1 (96–100 percent overlap); 48 percent yielded effect sizes between 0.11 and 0.35 (96–86 percent overlap), 15 percent yielded effect sizes between 0.36 and 0.65 (86–74.5 percent overlap; and 6 percent yielded effect sizes between 0.66 and 1 (74–62 percent overlap; see their table 2). Therefore, for psychological variables, women and men tend to belong to distributions that highly overlap, which prompted Hyde (2005) to propose the gender similarities hypothesis.
In a more recent meta-analysis, Hyde (2014) discusses how some effect sizes have changed through the past decades, especially in the cognitive domain (from large to moderate for spatial skills, for example, and from moderate to small or null in math performance), which demonstrates how they can be sensitive to cultural contexts and vary across countries. This pattern reveals the role of possible covariates of sex/gender differences.
Index of Similarity. The effect size measure provides a measure of difference; however, relying on the property of the normal curve, measures of the percentage of overlap between two distributions can be calculated. As Cohen’s d does not provide information on the features of the distribution (e.g., degree of skewness), Nelson (2015) proposes a more intuitive and direct measure of overlap between groups, the Index of Similarity (IS). It is calculated as follows:
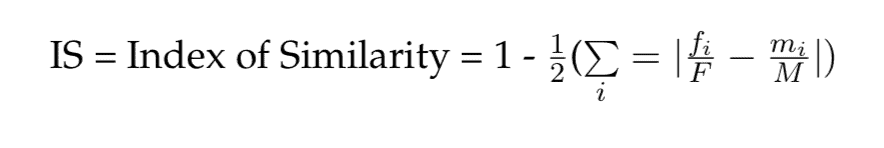
where fi/F is the proportion of women with a given score i, and mi/M is the proportion of men with the same score. The IS varies between 0 (no scores in common) and 1 (complete matchup between the scores in the two groups). An IS of 0.5 means that 50 percent of individuals in one group can be matched with an individual in the other group with exactly the same score. Unlike Weitzman’s ?, which can applied only to distributions of data that are assumed to be normal and therefore have specific mathematical properties, this statistic can be calculated regardless of the shape of the data distributions.
Nelson (2015) applies this measure to better delineate sex differences in risk aversion in financial settings. Nelson notes that the two sexes are frequently portrayed in the economics literature as fundamentally different in terms of psychological characteristics tied to financial decision-making. Nelson conducted a meta-analysis on thirty-five scholarly studies, including many in which no statistically significant differences were found between the groups. Typically, the IS was larger than 0.8, which implies that more than 80 percent of participants in the two groups showed the same score on measures of risk aversion. Clearly, claims of fundamental or essential differences are unwarranted in this case.
2.1.2 Reporting Null Results
The bias against publication of null results (Hubbard and Armstrong 1997) is arguably partially responsible for the problem of replicability in science (Ioannidis 2005). The recent introduction of a three-year funding initiative by the Netherlands Organization for Scientific Research specifically for replication studies (Baker 2016) indicates that the need for a better balance between novel research and replication is beginning to be recognized. Beyond replication, arguably, reporting null results is critical to mitigating the effects of false positives (Shields 2000; Ioannidis 2006; Ferguson and Heene 2012). For example, a recent meta-analysis (David et al. 2018) on neuroscientific studies reporting sex/gender differences identified excess significance bias (a lack of expected statistical relationship between reported significance and sample size) as an important problem within this body of literature.
2.1.3 Randomization Control
To assess the specificity of sex/gender effects in neuroimaging, one proposed method is a randomization control procedure in which groupings based on randomly assigned individuals are tested in parallel with the groups of interest (Frost et al. 1999). Here, “specificity” refers to the ability to establish whether positive results can be obtained by chance or be due to other factors, such as uneven variability within the sample, thus protecting against false positives. With the stated goal of investigating sex differences in lateralization for language processing, the authors carried out analyses on two groups of fifty women and fifty men performing two monitoring tasks, one semantic and one auditory. In addition, the authors ran the same sets of analyses on two randomly generated groups comprising an equal number of participants from those two sex/gender groups. As the authors mention, this technique provides an estimate of variability expected by chance in a sample (Frost et al. 1999, 201). The subtraction between activation in the semantic versus auditory task yielded statistically significant activation that was larger in the left compared to the right hemisphere. Sex/gender did not modulate this pattern. The same results were obtained in the analysis of randomly assigned groups. In other words, women and men did not differ in the patterns of brain activation associated with processing language.
In a more recent study aimed at investigating possible neural correlates of purported sex/gender differences in humor processing (Chan 2016), participants were initially grouped into women and men. The authors then systematically altered the number of women and men in the two groups to be compared until the number of each was identical (pseudorandom assignment; 11–12). The authors found that sex/gender influenced the neural correlates of different types of jokes. Because, with the exception of one analysis, they did not find such an effect in random groups, the authors concluded that the effects comparing women and men reflected a real sex/gender effect.
Therefore, the group randomization procedure allows researchers to interpret their effects more accurately. The following scenarios can be obtained:
1. Difference between female and male groups and lack of difference between random groups → sex/gender effect is real;
2. No difference between female and male groups and no difference between random groups → no sex/gender effect;
3. Difference between female and male groups and difference between random groups
→ possible false positive;
4. No difference between female and male groups and difference between random groups
→ Unclear. This result would be difficult to interpret but would suggest that further tests (e.g., permutation testings) are needed to deal with a sample that could be skewed.
2.1.4 Permutation Testing
Permutation testing, a form of nonparametric testing originally proposed by Fisher (1937), has been in recent years recommended as tool for statistical testing in data-intensive research, including neuroimaging (Holmes et al. 1996; Arndt et al. 1996) and genomics (Nettleton and Doerge 2000). Permutation testing is a randomization procedure in which the data are repeatedly resampled to construct a null distribution. In other words, the data within or between subjects are randomized thousands of times in order to create a statistical distribution that represents the form of the dataset that is being studied. The subsequent statistical comparison of two groups is tested against this null distribution, which permits us to determine whether a true difference exists between the two groups or whether that difference is simply an artefact of the sample’s makeup. Unlike the more common parametric statistical tools, permutation testing avoids assumptions of normal distribution, homoscedasticity, and nonrandom sampling (Pesarin and Salmaso 2012).
As an example, we can examine the particular challenges of analyzing neuroimaging data. MRI scans are made up of a series of small three-dimensional pixels, called voxels. Data are analyzed on a voxel-by-voxel basis (voxelwise comparisons), which easily results in a large number of comparisons (Nichols and Holmes 2002) and therefore vulnerability to false positives. This problem can be exacerbated by small sample sizes. These characteristics, along with high levels of variance within voxels between individual scans and noise (Holmes et al. 1996), make the assumptions of parametric testing problematic for these sorts of data.
One type of permutation testing is label permutation, in which data between subjects are permuted. Here, subjects in the population are randomly assigned to groups in repeated iterations, creating, for example, thousands of randomized groupings. These repeated iterations build up a sampling distribution, which assumes that all differences between randomly generated groups are equally likely (Nichols and Holmes 2002). In the final t-test (or other significance test), the difference between the groups is evaluated against this sample distribution. Label permutation is an effective way to guard against false positives when testing for differences between groups assigned to sex/gender categories. Permutation testing is computationally expensive, which accounts for its underuse until recently, but it is now an accessible and rigorous statistical tool.
2.2 Gender/Sex Differences in White Matter: A Case Study
In the present study, we investigate the variable of sex/gender in areas of the brain correlated with language processing. We aim to provide a feminist intervention into the traditional sex/gender categories used in brain mapping by applying alternative analytical and statistical methods to capture and interrogate the variability level in brain organization across individuals. To address this goal, we focus on Broca’s area (BA44 and BA45). This area has been investigated intensively (Shaywitz et al. 1995; Frost et al. 1999; Kaiser et al. 2009; Kurth, Jancke, and Luders 2017; Allendorfer et al. 2012; Plante et al. 2006; Hahn et al. 2016) with the aim of finding a structural difference that would explain women’s purportedly superior linguistic skills compared to men (note that behavioral differences in the linguistic domain have been questioned on several grounds, but persistently have been invoked; see review by Wallentin, 2009). For example, in a recent study, Kurth et al. (2017) found that the grey matter volume of BA44 and BA45 in both hemispheres is larger in women than men. In a study on a different dependent variable, white matter volume, Shiino et al. (2017) found that the white matter near to the left Broca’s area was larger in women than men. In an earlier study, Szeszko et al. (2003) found that for measures of fractional anisotropy (FA), a proxy for reconstructing the directionality of white matter tracts in the brain, women had higher values than men.
In the following case study, we provide an example of how to conduct analyses that focus on quantifying variability and similarities instead of differences. While this approach might appear to reify a dichotomy that we reject at the outset as it validates the assumptions that sustain sex/gender difference research, our goal is to provide the readers with methods to describe and quantify the distribution of data when humans are placed into separate groups based on sex, 8 and therefore to offer a more nuanced view of what expressions such as “sexual dichotomy” or “sex differences” reflect.
2.2.1 Methods
We analyzed preprocessed magnetic resonance (MR) scans from seventy-five adult individuals, available from the Human Connectome Project’s (Van Essen et al. 2013; Glasser et al. 2013) 9 S500 release (Sotiropoulos et al. 2013; Andersson, Skare, and Ashburner 2003; Andersson and Sotiropoulos 2015, 2016). 10
In order to examine sex/gender similarities and differences in Broca’s area, we chose to examine white matter structural differences using a type of MRI known as diffusion-weighted imaging. Diffusion-weighted data are used to calculate FA, the small-scale movement of fluid within the brain. 11 FA values, in turn, are used to reconstruct the direction and integrity of white matter tracts in the brain. To quantify differences in white matter organization between individuals, we used a software package that calculates an averaged white matter map, or FA skeleton, from the analysis of a sample of individual scans (tract-based spatial statistics or TBSS; Smith et al. 2006 in FSL; Jenkinson et al. 2012). 12
Based on the intervention randomization control outlined in 2.1.3, subject scans were assigned to four two-group sets. In addition to being divided into a women/men set, the subject sample was broken into three different two-group sets using three different randomization techniques with similar numbers of women and men (table 1). Set 2 was randomized using an atmospheric noise generator (random.org, c. 1998–2017), set 3 using a date-input randomizer (GraphPad.com, c. 2017), and set 4 using the randomize function (rand) in Microsoft Excel (version 15.3).
Next, we applied permutation analysis described in the previous section on feminist interventions (see 2.1.4). We ran a one-way between-subjects ANOVA independently for each grouping for 5,000 permutations. 13 We ran this analysis for both the entire brain and for the region of interest (ROI) in the study, that is, the area that includes white matter tracts involved in language production. This ROI is comprised of three major white matter tract systems (figure 3A). 14 A subdivision of one of these tracts, the third branch of the left superior longitudinal fasciculus (SLF III) extends into BA44, part of Broca’s area (Frey et al. 2008; Parker et al. 2005), and is implicated in language processing (Saur et al. 2008; Friederici et al. 2006). Few studies on the SLF have examined sex/gender differences; those that have found differences in SLF measures between sexes/genders have reported them in the right hemisphere (Bava et al. 2011; Rametti et al. 2011). Another tract we selected, the inferior longitudinal fasciculus (ILF), passes through the temporal lobe and reaches the temporal pole, and has been suggested to underpin semantic processing (Saur et al. 2008; Wong et al. 2011).
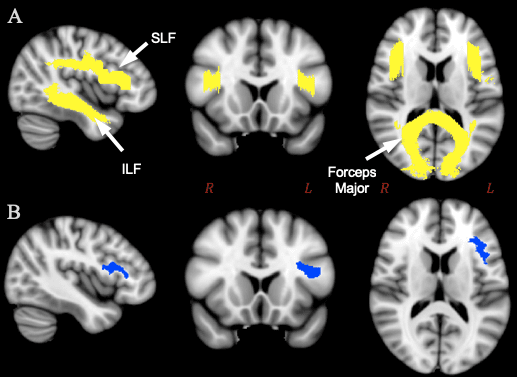
Following whole-brain and ROI-based analyses of differences between groups in the white matter skeleton, we created a second ROI in the left hemisphere, delineating white matter beneath Broca’s area (figure 3B). 15 We computed average FA values for the Broca’s area ROI within each individual using the program fslmaths 16 (FSL, Jenkinson et al., 2012). One subject was removed from analysis (110411) because the averaged FA values for the Broca’s ROI were an outlier and likely an artefact of that particular subject in the dataset with a value of 0.99 out of a maximum possible value of 1. The four groupings were analyzed using one-way between-subjects ANOVAs; furthermore, measures of effects size (Cohen’s d) and overlap (Weitzman’s ?) were calculated using the tools available on sexdifference.org (Maney 2016) as a way to perform the feminist interventions described above.
2.2.2 Results
For our TBSS analysis of white matter, we found no significant differences in FA values in the white matter skeleton between any of the groups in the four sets tested (table 2). This is true for both the whole brain and ROI comparisons. To report this null result is regarded as another feminist intervention in this paper (see 2.1.2) and as good science (Hubbard and Armstrong 1997). P-values for a t-test of whole brain voxelwise analysis reached low values (p=0.090) in the second grouping (table 2), which was surprising, because the group assignment was randomized based on numbers generated from atmospheric noise. P-values reached a similar level of significance for ROI-based analysis in women versus men (p=0.088).
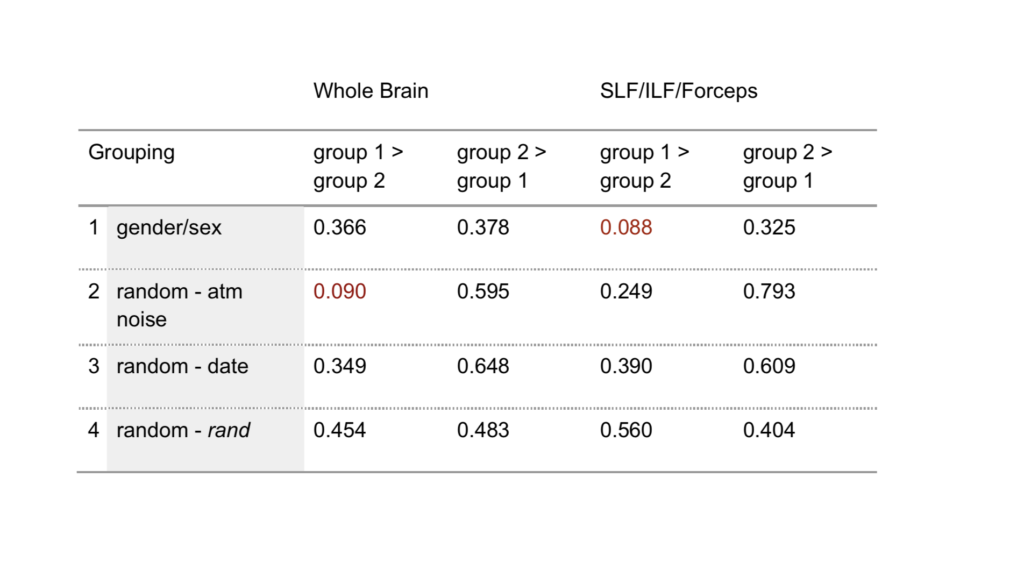
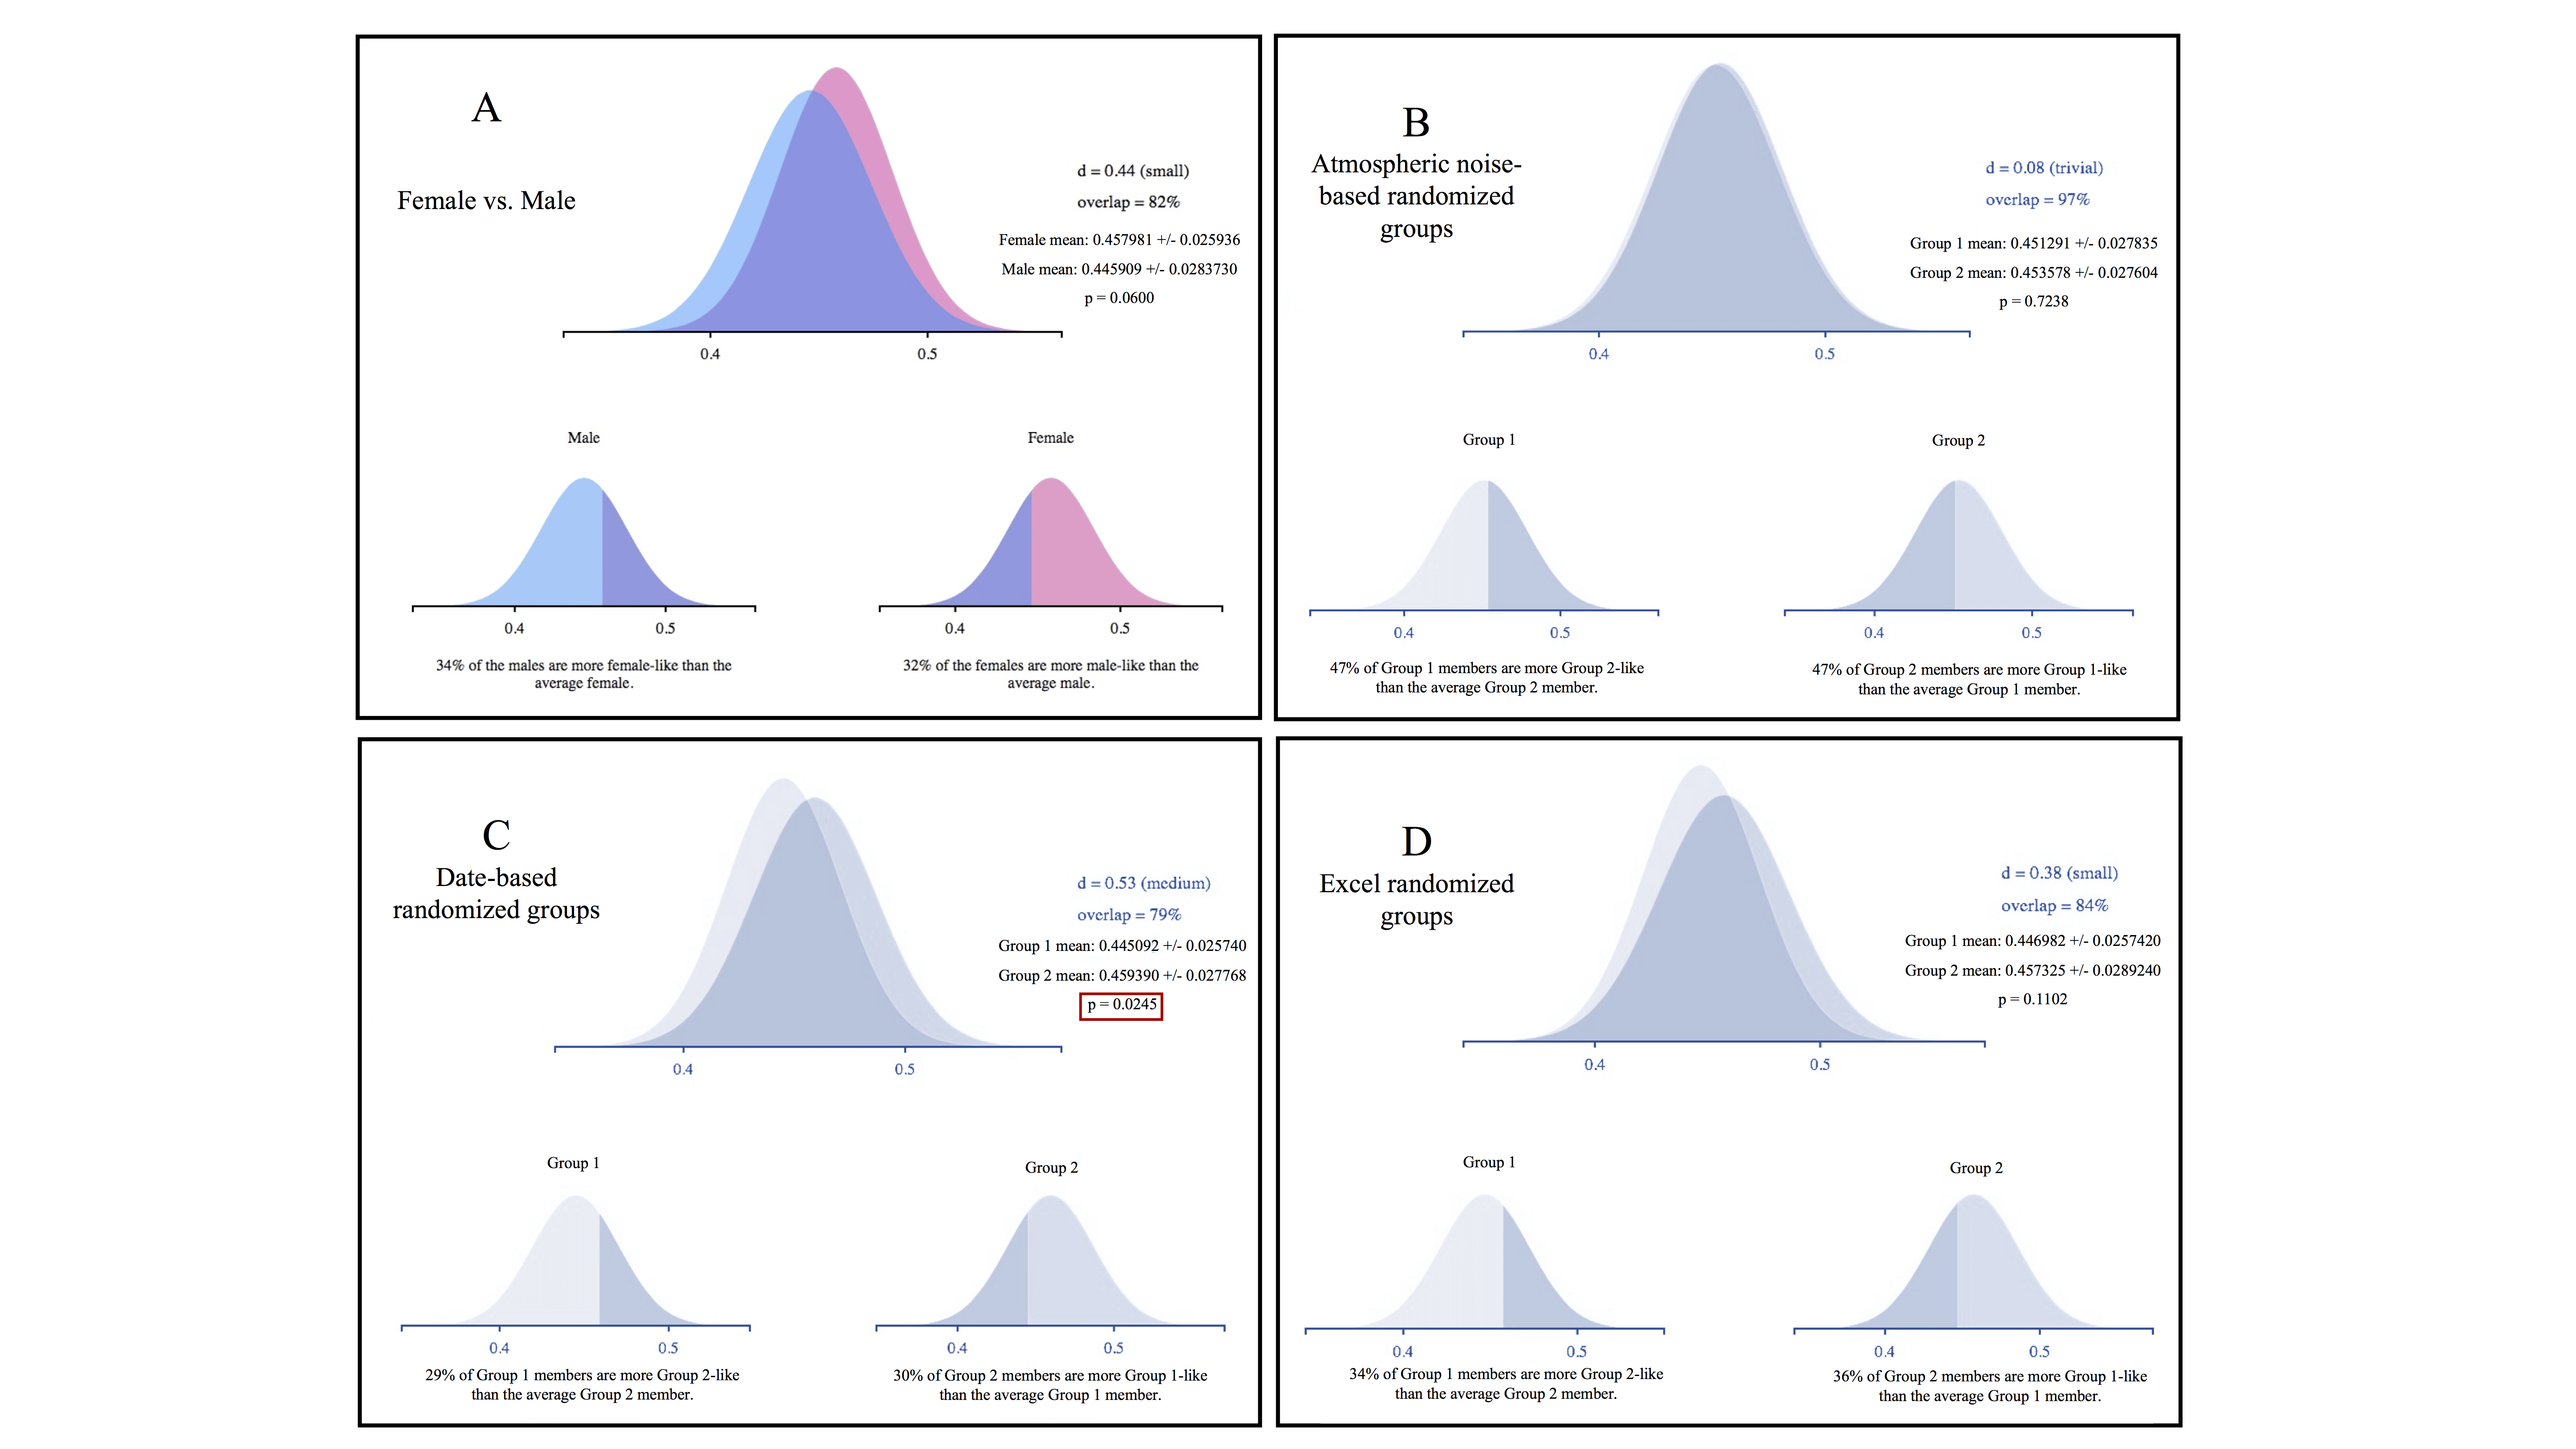
For our individualized Broca’s area ROI, analysis of averaged FA values across subjects demonstrated no significant differences between women and men. In addition, there were no significant differences between groups in two of our three randomized groupings (figure 4A, B, and D). Differences between groups did reach significance in our second randomized grouping, however (p=0.025; figure 4C). Effect size was trivial to small for all groups except the second randomized group, which reached a medium level of effect size (Cohen’s d=0.53).
Weitzman’s ?, a coefficient of overlap between two populations, ranged from a low of 79 percent overlap for the date-based randomized group (figure 4C) to a high of 97 percent overlap for the atmospheric noise-based randomized grouping (figure 3B). The women/men comparison was between these levels at 82 percent (figure 4A). In the latter case, 34 percent of men had FA levels that were more “woman-like” than the average female subject, and 32 percent of women had values that were more “man-like” than the average male subject. Similar values for Weitzman’s ? in the randomized groupings suggest that the degree of overlap is an artefact of the dataset and not representative of a real difference between women and men for FA values in Broca’s area. Similarly, figure 1 shows that measures of variability and confidence interval can be similar between women/men and random groups.
2.2.3 Discussion
As measured by FA, the directionality and integrity of white matter was not statistically different between women and men or between random groupings within the Human Connectome Project diffusion dataset when examined using tract-based spatial statistics with permutation testing. P-values failed to reach significance for any of the randomized groupings or the women/men grouping; however, values were low enough for the fascicular ROI analysis in the women/men grouping (p=0.088) to suggest a possible group difference. The fact that a randomized grouping reached a nearly identical p-value for the whole brain analysis (0.09) indicates that even a robust statistical method like permutation testing can produce results that flirt with significance.
It is important to underscore that the permutation test we ran in the general linear model repeatedly resamples the data for a set number of iterations (in this case: 5,000 iterations) to compute a null distribution against which we compared the two groups. Hence, the general linear model does not assume a sampling distribution but instead reshuffles the data to test our comparison against all possible alternative group assignments. The larger the number of permutations, the more robust the null distribution and the more reliable the statistical result. Therefore, although our random assignments are not necessarily unique from the permutations that iterate in the general linear model, they do allow us to examine how robust permutation testing is against false positive results. Here, we selected 5,000 iterations because this number is commonly used for TBSS studies (e.g., Smith et al. 2006; Bosch et al. 2012; Lee et al. 2013). Results of a permutation analysis of 5,000 iterations that are close to significance are not always reliable – Dickie et al. (2015) found 10,000 is preferable for certain kinds of structural neuroimaging – but may encourage a researcher to continue to investigate a certain statistical relationship.
We did not observe any sex/gender effects for FA values within the white matter in our Broca’s area ROI analysis. The high degree of overlap between the men and women groupings and small effect size underscore the similarity between these two populations. The significant results we observed for one of the randomized groupings (figure 4C) suggest that even decent-sized samples (n=76) in neuroimaging do not preclude false positive errors.
Presumed sex/gender differences in language abilities have led some researchers to investigate Broca’s area as a putative site of neuroanatomical difference between men and women, with mixed results (Harasty et al. 1997; Leonard et al. 2008; Wallentin 2009). The fact that our tests failed to find any statistical sex/gender differences in SLF and ILF tracts suggests there are no structural differences in the directionality of white matter tracts that interface with prefrontal and anterior temporal areas between women and men. The lack of significant difference between groups, the high overlap in scores and similarity of variability measures, and the small effect size of sex/gender on a measure of white matter integrity in Broca’s area further support the interpretation that “male brains” and “female brains” are more similar than they are different when it comes to white matter in territories that are important for language processing.
In summary, our results demonstrate that (1) no significant differences between women and men were observable in the FA values within major white matter tracts involved in language processing, and that (2) FA values for white matter within Broca’s area show no significant difference, small effect size, and a high degree of overlap between the two groups. Our results also permit two methodological observations: first, when testing neuroanatomical differences between groups at lower permutation levels, it is possible to produce results that appear to reach for significance, even when group assignments are randomly generated; second, randomized groupings can induce statistically significant results in neuroimaging analyses. For scientists who are exploring sex/gender differences, especially in data-intensive fields like neuroimaging, these findings highlight the importance of using statistical tools that are robust to false positive errors. Taken together, these results highlight the lack of structural differences between sexes/genders in brain areas important for language processing (thus making the application of measurements of variability necessary), the risk of generating spurious positive results with conventional statistical tools in neuroimaging analyses, and the utility of feminist methodological interventions for increasing rigor in these types of studies.
3. General Discussion
Deboleena Roy asks of fellow feminist scientists: “where are the blood and guts in our feminist attempts to go back to the body?” (2008, 226) In other words, where can we find feminist knowledge production in the laboratory? As empirical neurofeminists, we have attempted to answer this call by describing and applying methodological tools that sex/gender differences researchers can use to provide a more comprehensive picture of their data. They include adding random groups and permutation analyses to protect against false positives, reporting effect sizes and the variability in the data, estimating the overlap/similarity between groups, and reporting null results.
The picture that emerges invites the reader to develop a more complex narrative, one that does not speak of two distinct types of brains. We have termed these tools feminist interventions – not to claim that they were devised by feminist (neuro)scientists (this is not the case), but to indicate that their adoption challenges the status quo in sex/gender research and produces more precise results, and therefore a more nuanced narrative, in this field.
When these tools are applied, it becomes clear that claims of dimorphism are often misleading. In their paper on “Sexual Dimorphism in Broca’s Area,” Kurth et al. (2017) used expressions such as female and male brains (e.g., 630); while they are sometimes careful to acknowledge that differences are found “on average” (630), the untrained reader will likely assume that the two distributions barely overlap, as the language conveys the idea that there are two entities, whose difference is honored by the use of two different adjectives. 17 For this reason, Joel & Fausto-Sterling (2016) suggest using different expressions, such as “comparing brains from males to brains from females.”
This use of “dimorphism” as a proxy for “sex difference” is not specific to Kurth et al., but is widespread in the psychological and neuroscientific literature (e.g., Cahill 2006; Goldstein et al. 2001). Some authors have indeed raised issues regarding the casual use of this term. For example, Ball et al. (2014) discuss various forms of sex differences and suggest reserving “dimorphism” only for traits whose distributions in female and male animals do not overlap. Differences in traits characterized by various degrees of overlap should be referred to as “sex differences” (629). Such differences can then be quantified, for example based on effect size. This use of dimorphism remains faithful to the original meaning of the term (and probably to readers’ intuitions) and helps to avoid misunderstanding, especially when effect sizes are not reported.
We maintain that statistical significance tests cannot be considered the ultimate evidence with which to investigate differences between groups. This statement is valid regardless of the nature of the variables under investigation, but it is especially important when hot topics, such those related to sex/gender, are addressed, as a focus on differences between group means can sustain sex/gender essentialism. The evidence available from neuroimaging studies does not justify claims of dimorphism (Joel et al. 2015). Furthermore, it is rarely consistent. Some authors (e.g., Cahill 2006) maintain that sex differences in the brain are pervasive. Certainly, a long list of references from the neuroimaging literature can be compiled, but, as discussed in the introduction, frequently results fail to be replicated (e.g., Sommer et al. 2004). Differences appear and disappear depending on a variety of factors including, but not limited to, subtle variations in task, data manipulation techniques, and choices such as what measure to choose. 18 Indeed, many published works claim to aim to resolve discrepancies between previous findings. Given all these issues, we wonder whether it is possible to move away from a never-ending cycle of incongruous findings, one in which every new study adds to the existing discrepancy, and to instead move toward a more productive framework.
We certainly do not aim to discourage certain lines of inquiries and we acknowledge that discrepancies are present in virtually every field or discipline. However, we do encourage researchers to adopt caution before making wide-ranging statements based on a single paper. For example, Ingalhalikar et al.’s (2014) findings of different connectivity patterns in women’s and men’s brains – a study Cahill (2014) heralded as revealing “fundamental sex differences in human brain architecture” – did not survive a correction based on brain size (Hänggi et al. 2014; see also Martínez et al. 2017). Hänggi et al. found a relationship between connectivity patterns and brain size; the sex differences that they observed disappeared after they adjusted their measures by brain size. They also reanalyzed Ingalhalikar et al.’s data by selecting twenty-seven women and twenty-seven men at random. They replicated Ingalhalikar et al.’s results; but once again, the differences in connectivity disappeared when the groups of randomly selected women and men were matched based on brain size.
Taken together, the approaches used in this study (random group assignment, effect sizes, Cohen’s d, overlap measures, and permutation analysis) and recommendations (reporting null results), comprise a feminist methodological toolkit that offers a richer characterization of data than conventional analyses by both (1) avoiding the reduction of sample populations to simple averages, and (2) considering variability within populations to be informative. We wonder whether these tools and a renewed attention to measures of variability and overlap can foster the development of new questions not only about sex/gender but also about other factors that could help to unpack the variability that remains unaccounted. Substantial overlap between groups suggests that other factors are responsible for variation among individuals. For example, as mentioned above, Kurth et al. (2017) found that that BA44 and BA45 were larger, on average, in female than male participants in both hemispheres. The effect sizes were small and ranged from 0.21 to 0.30, which correspond to r2 varying between 0.01 to 0.02. That is, at least 98 percent of the variance concerning the size of these regions remained unaccounted for.
We encourage researchers in the field to apply the interventions explored in this paper, elaborate on them, and create new ways to think, conceptualize, classify, and especially measure “sex/gender” in brain science. We also encourage researchers to adopt a critical view of how current research is carried out. The “searching for group differences” approach, still dominant, is fraught with interpretational problems; as a result, it has added very little to our understanding of sex/gender. It has also revealed a curious lack of interest in exploring mechanisms. Instead, these are often black boxed (e.g., “sex chromosomes,” and especially “sex hormones”) and assumed to explain differences when differences are found. New approaches are needed to move beyond the stagnation that has characterized the field for too long.
Bibliography
Allendorfer, Jane B., Christopher J. Lindsell, Miriam Siegel, Christi L. Banks, Jennifer Vannest, Scott K. Holland, and Jerzy P. Szaflarski. 2012. “Females and Males Are Highly Similar in Language Performance and Cortical Activation Patterns during Verb Generation.” Cortex; A Journal Devoted to the Study of the Nervous System and Behavior 48, no. 9: 1218–33. Psy-journal.com.
Andersson, Jesper L.R., Stefan Skare, and John Ashburner. 2003. “How to Correct Susceptibility Distortions in Spin-Echo Echo-Planar Images: Application to Diffusion Tensor Imaging.” NeuroImage 20, no. 2: 870–88.
Andersson, Jesper L.R., and Stamatios N. Sotiropoulos. 2015. “Non-parametric Representation and Prediction of Single- and Multi-shell Diffusion-Weighted MRI Data Using Gaussian Processes.” NeuroImage 122 (November): 166–76. Elsevier.
–. 2016. “An Integrated Approach to Correction for off-Resonance Effects and Subject Movement in Diffusion MR Imaging.” NeuroImage 125 (January): 1063–78. Elsevier.
Arndt, S., T. Cizadlo, N.C. Andreasen, D. Heckel, S. Gold, and D.S. O’Leary. 1996. “Tests for Comparing Images Based on Randomization and Permutation Methods.” Journal of Cerebral Blood Flow and Metabolism 16, no. 6: 1271–79. Sage.
Baker, Monya. 2016. “REPRODUCIBILITY CRISIS?” Nature 533, 26.
Bakker, Rembrandt, Paul Tiesinga, and Rolf Kötter. 2015. “The Scalable Brain Atlas: Instant Web-Based Access to Public Brain Atlases and Related Content.” Neuroinformatics 13, no. 3: 353–66. Springer.
Ball, Gregory F., Jacques Balthazart, and Margaret M. McCarthy. 2014. “Is It Useful to View the Brain as a Secondary Sexual Characteristic?” Neuroscience and Biobehavioral Reviews 46: 628–38. Elsevier.
Bava, Sunita, Veronique Boucquey, Diane Goldenberg, Rachel E. Thayer, Megan Ward, Joanna Jacobus, and Susan F. Tapert. 2011. “Sex Differences in Adolescent White Matter Architecture.” Brain Research 1375 (February): 41–8. Elsevier.
Bishop, K.M., and D. Wahlsten. 1997. “Sex Differences in the Human Corpus Callosum: Myth or Reality?” Neuroscience and Biobehavioral Reviews 21, no. 5: 581–601. Elsevier.
Blatter, D.D., E.D. Bigler, S.D. Gale, S.C. Johnson, C.V. Anderson, B.M. Burnett, N. Parker, S. Kurth, and S.D. Horn. 1995. “Quantitative Volumetric Analysis of Brain MR: Normative Database Spanning 5 Decades of Life.” AJNR: American Journal of Neuroradiology 16, no. 2: 241–51. Am Soc.
Cahill, Larry. 2006. “Why Sex Matters for Neuroscience.” Nature Reviews. Neuroscience 7, no. 6: 477–84. Proquest.
–. 2014. “Fundamental Sex Difference in Human Brain Architecture.” Proceedings of the National Academy of Sciences of the United States of America 111, no. 2: 577–78. National Acad.
Calin-Jageman, Robert, and Geoff Cumming. 2018. “The New Statistics for Better Science: Ask How Much, How Uncertain, and What Else Is Known.” PsyArXiv. https://psyarxiv.com/3mztg/download?format=pdf.
Champagne, Frances A. 2013. “Epigenetics and Developmental Plasticity across Species.” Developmental Psychobiology 55, no. 1: 33–41. Wiley Online Library.
Chan, Yu-Chen. 2016. “Neural Correlates of Sex/Gender Differences in Humor Processing for Different Joke Types.” Frontiers in Psychology 7 (April): 536. ncbi.nlm.nih.gov.
Clayton, Janine A., and Francis S. Collins. 2014. “Policy: NIH to Balance Sex in Cell and Animal Studies.” Nature 509, no. 7500: 282–3. Nature.com.
Courchesne, E., H.J. Chisum, J. Townsend, A. Cowles, J. Covington, B. Egaas, M. Harwood, S. Hinds, and G.A. Press. 2000. “Normal Brain Development and Aging: Quantitative Analysis at in Vivo MR Imaging in Healthy Volunteers.” Radiology 216, no. 3: 672–82. Pubs.rsna.org.
David, Sean P., Florian Naudet, Jennifer Laude, Joaquim Radua, Paolo Fusar-Poli, Isabella Chu, Marcia L. Stefanick, and John P.A. Ioannidis. 2018. “Potential Reporting Bias in Neuroimaging Studies of Sex Differences.” Scientific Reports 8, no. 1: 6082. Nature.com.
DeLacoste-Utamsing, C., and R.L. Holloway. 1982. “Sexual Dimorphism in the Human Corpus Callosum.” Science 216, no. 4553: 1431–2.
Desikan, Rahul S., Florent Ségonne, Bruce Fischl, Brian T. Quinn, Bradford C. Dickerson, Deborah Blacker, Randy L. Buckner, et al. 2006. “An Automated Labeling System for Subdividing the Human Cerebral Cortex on MRI Scans into Gyral Based Regions of Interest.” NeuroImage 31, no. 3: 968–80. Elsevier.
Dickie, David A., Shadia Mikhael, Dominic E. Job, Joanna M. Wardlaw, David H. Laidlaw, and Mark E. Bastin. 2015. “Permutation and Parametric Tests for Effect Sizes in Voxel-Based Morphometry of Gray Matter Volume in Brain Structural MRI.” Magnetic Resonance Imaging 33, no. 10: 1299–305.
Driesen, Naomi R., and Naftali Raz. 1995. “The Influence of Sex, Age, and Handedness on Corpus Callosum Morphology: A Meta-Analysis.” Psychobiology 23, no. 3: 240–7. Springer-Verlag.
Duprez, Daniel A., David R. Jacobs Jr, Pamela L. Lutsey, David Herrington, Darryl Prime, Pamela Ouyang, R. Graham Barr, and David A. Bluemke. 2009. “Race/Ethnic and Sex Differences in Large and Small Artery Elasticity – Results of the Multi-ethnic Study of Atherosclerosis (MESA).” Ethnicity & Disease 19, no. 3: 243–50. ncbi.nlm.nih.gov.
Eich, Eric. 2014. “Business Not as Usual.” Psychological Science 25, no. 1: 3–6. Sage.
Fausto-Sterling, A., and D. Joel. 2014. “The Science of Difference: Let’s Do It Right!” Huffington Post, https://www.huffingtonpost.com/dr-anne-fausto-sterling/the-science-of-difference-lets-do-it-right_b_5372859.html.
Fausto-Sterling, Anne. 2000. Sexing the Body: Gender Politics and the Construction of Sexuality. Basic Books.
Fausto-Sterling, Anne. 2005a. “The Bare Bones of Sex: Part 1 – Sex and Gender.” Signs: Journal of Women in Culture and Society 30, no. 2: 1491–527.
–. 2005b. “The Problem with Sex/Gender and Nature/Nurture.” In Debating Biology, 133–42. Routledge.
Ferguson, Christopher J., and Moritz Heene. 2012. “A Vast Graveyard of Undead Theories: Publication Bias and Psychological Science’s Aversion to the Null.” Perspectives on Psychological Science: A Journal of the Association for Psychological Science 7, no. 6: 555–61. Sage.
Fine, Cordelia. 2010a. Delusions of Gender: How Our Minds, Society, and Neurosexism Create Difference. W.W. Norton & Company.
–. 2010b. “From Scanner to Sound Bite: Issues in Interpreting and Reporting Sex Differences in the Brain.” Current Directions in Psychological Science 19, no. 5: 280–3. Sage.
Cordelia Fine (2018). Feminist science: who needs it? The Lancet, Volume 392: 1302-1303.
Fisher, Ronald Aylmer. 1937. The Design of Experiments. Edinburgh: Oliver and Boyd.
Frey, Stephen, Jennifer S.W. Campbell, G. Bruce Pike, and Michael Petrides. 2008. “Dissociating the Human Language Pathways with High Angular Resolution Diffusion Fiber Tractography.” The Journal of Neuroscience 28, no. 45: 11435–44. Soc Neuroscience.
Friederici, Angela D., Jörg Bahlmann, Stefan Heim, Ricarda I. Schubotz, and Alfred Anwander. 2006. “The Brain Differentiates Human and Non-human Grammars: Functional Localization and Structural Connectivity.” Proceedings of the National Academy of Sciences of the United States of America 103, no. 7: 2458–63. National Acad Sciences.
Frost, J.A., J.R. Binder, J.A. Springer, T.A. Hammeke, P.S. Bellgowan, S.M. Rao, and R.W. Cox. 1999. “Language Processing Is Strongly Left Lateralized in Both Sexes. Evidence from Functional MRI.” Brain: A Journal of Neurology 122 (part 2) (February): 199–208. academic.oup.com.
Gilmore, John H., Weili Lin, Marcel W. Prastawa, Christopher B. Looney, Y. Sampath K. Vetsa, Rebecca C. Knickmeyer, Dianne D. Evans, et al. 2007. “Regional Gray Matter Growth, Sexual Dimorphism, and Cerebral Asymmetry in the Neonatal Brain.” The Journal of Neuroscience 27, no. 6: 1255–60. Soc Neuroscience.
Giordano, Sara. 2014. “Scientific Reforms, Feminist Interventions, and the Politics of Knowing: An Auto-ethnography of a Feminist Neuroscientist.” Hypatia 29, no. 4: 755–73. Wiley.
Glasser, Matthew F., Stamatios N. Sotiropoulos, J. Anthony Wilson, Timothy S. Coalson, Bruce Fischl, Jesper L. Andersson, Junqian Xu, et al. 2013. “The Minimal Preprocessing Pipelines for the Human Connectome Project.” NeuroImage 80 (October): 105–24.
Goldstein, J.M., L.J. Seidman, N.J. Horton, N. Makris, D.N. Kennedy, V.S. Caviness Jr, S.V. Faraone, and M.T. Tsuang. 2001. “Normal Sexual Dimorphism of the Adult Human Brain Assessed by in Vivo Magnetic Resonance Imaging.” Cerebral Cortex 11, no. 6: 490–97. academic.oup.com.
Good, C.D., I. Johnsrude, J. Ashburner, R.N. Henson, K.J. Friston, and R.S. Frackowiak. 2001. “Cerebral Asymmetry and the Effects of Sex and Handedness on Brain Structure: A Voxel-Based Morphometric Analysis of 465 Normal Adult Human Brains.” NeuroImage 14, no. 3: 685–700. Elsevier.
Gottlieb, G. 1998. “Normally Occurring Environmental and Behavioral Influences on Gene Activity: From Central Dogma to Probabilistic Epigenesis.” Psychological Review 105, no. 4: 792–802. doi.apa.org.
GraphPad Software: Quickcalcs. c. 2017. GraphPad Software, Inc. www.graphpad.com/quickcalcs.
Grossi, G., D. Coch, S. Coffey-Corina, P.J. Holcomb, and H.J. Neville. 2001. “Phonological Processing in Visual Rhyming: A Developmental Erp Study.” Journal of Cognitive Neuroscience 13, no. 5: 610–25. MIT Press.
Gur, R.C., B.I. Turetsky, M. Matsui, M. Yan, W. Bilker, P. Hughett, and R.E. Gur. 1999. “Sex Differences in Brain Gray and White Matter in Healthy Young Adults: Correlations with Cognitive Performance.” The Journal of Neuroscience 19, no. 10: 4065–72.
Hahn, Andreas, Georg S. Kranz, Ronald Sladky, Ulrike Kaufmann, Sebastian Ganger, Allan Hummer, Rene Seiger, et al. 2016. “Testosterone Affects Language Areas of the Adult Human Brain.” Human Brain Mapping 37, no. 5: 1738–48. Wiley.
Hänggi, Jürgen. 2011. “Consideration of Effect Sizes in the Discussion of Sex versus Brain Size as a Driving Force of Differences in the Human Structural Connectome!” http://www.juergenhaenggi.ch/index.php?option=com_content&view=category&layout=blog&id=58&Itemid=136.
Hänggi, Jürgen, Laszlo Fövenyi, Franziskus Liem, Martin Meyer, and Lutz Jäncke. 2014. “The Hypothesis of Neuronal Interconnectivity as a Function of Brain Size – A General Organization Principle of the Human Connectome.” Frontiers in Human Neuroscience 8: 915. frontiersin.org.
Harasty, J., K.L. Double, G.M. Halliday, J.J. Kril, and D.A. McRitchie. 1997. “Language-Associated Cortical Regions Are Proportionally Larger in the Female Brain.” Archives of Neurology 54, no. 2: 171–6. archneur.jamanetwork.com.
Haraway, Donna. 1988. “Situated Knowledges: The Science Question in Feminism and the Privilege of Partial Perspective.” Feminist Studies: FS 14, no. 3: 575–99.
–. 1991. “A Cyborg Manifesto.” New York.
Holloway, Ralph L. 2017. “In the Trenches with the Corpus Callosum: Some Redux of Redux.” Journal of Neuroscience Research 95, no. 1–2: 21–3. Wiley.
Holmes, A.P., R.C. Blair, J.D. Watson, and I. Ford. 1996. “Nonparametric Analysis of Statistic Images from Functional Mapping Experiments.” Journal of Cerebral Blood Flow and Metabolism: Official Journal of the International Society of Cerebral Blood Flow and Metabolism 16, no. 1: 7–22. Sage.
Hua, Kegang, Jiangyang Zhang, Setsu Wakana, Hangyi Jiang, Xin Li, Daniel S. Reich, Peter A. Calabresi, James J. Pekar, Peter C.M. van Zijl, and Susumu Mori. 2008. “Tract Probability Maps in Stereotaxic Spaces: Analyses of White Matter Anatomy and Tract-Specific Quantification.” NeuroImage 39, no. 1: 336–47. Elsevier.
Hubbard, Raymond, and J. Scott Armstrong. 1997. “Publication Bias against Null Results.” Psychological Reports 80, no. 1: 337–8. Sage.
Hyde, Janet Shibley. 2005. “The Gender Similarities Hypothesis.” The American Psychologist 60, no. 6: 581–92. psycnet.apa.org.
–. 2014. “Gender Similarities and Differences.” Annual Review of Psychology 65: 373–98. annualreviews.org.
Ihnen, S.K.Z., Jessica A. Church, Steven E. Petersen, and Bradley L. Schlaggar. 2009. “Lack of Generalizability of Sex Differences in the fMRI BOLD Activity Associated with Language Processing in Adults.” NeuroImage 45, no. 3: 1020–32. Elsevier.
Ingalhalikar, Madhura, Alex Smith, Drew Parker, Theodore D. Satterthwaite, Mark A. Elliott, Kosha Ruparel, Hakon Hakonarson, Raquel E. Gur, Ruben C. Gur, and Ragini Verma. 2014. “Sex Differences in the Structural Connectome of the Human Brain.” Proceedings of the National Academy of Sciences of the United States of America 111, no. 2: 823–8. National Acad Sciences.
Inman, Henry F., and Edwin L. Bradley. 1989. “The Overlapping Coefficient as a Measure of Agreement between Probability Distributions and Point Estimation of the Overlap of Two Normal Densities.” Communications in Statistics – Theory and Methods 18, no. 10: 3851–74. Taylor & Francis.
Ioannidis, John P.A. 2005. “Why Most Published Research Findings Are False.” PLoS Medicine 2, no. 8: e124. journals.plos.org.
–. 2006. “Journals Should Publish All ‘Null’ Results and Should Sparingly Publish ‘Positive’ Results.” Cancer Epidemiology, Biomarkers & Prevention: A Publication of the American Association for Cancer Research, Cosponsored by the American Society of Preventive Oncology 15, no. 1: 186.
Israel, Andrei L., and Carolyn Sachs. 2013. “A Climate for Feminist Intervention: Feminist Science Studies and Climate Change.” In Research, Action and Policy: Addressing the Gendered Impacts of Climate Change, 33–51. Springer.
Jäncke, L., J.F. Staiger, G. Schlaug, Y. Huang, and H. Steinmetz. 1997. “The Relationship between Corpus Callosum Size and Forebrain Volume.” Cerebral Cortex 7, no. 1: 48–56. academic.oup.com.
Jäncke, Lutz, Susan Mérillat, Franziskus Liem, and Jürgen Hänggi. 2015. “Brain Size, Sex, and the Aging Brain.” Human Brain Mapping 36, no. 1: 150–69. Wiley.
Jenkinson, Mark, Christian F. Beckmann, Timothy E.J. Behrens, Mark W. Woolrich, and Stephen M. Smith. 2012. “FSL.” NeuroImage 62, no. 2: 782–90. Elsevier.
Joel, Daphna. 2011. “Male or Female? Brains Are Intersex.” Frontiers in Integrative Neuroscience 5 (September): 57. ncbi.nlm.nih.gov.
–. 2012. “Genetic-Gonadal-Genitals Sex (3G-Sex) and the Misconception of Brain and Gender, or, Why 3G-Males and 3G-Females Have Intersex Brain and Intersex Gender.” Biology of Sex Differences 3, no. 1: 27. bsd.biomedcentral.com.
Joel, Daphna, and Anne Fausto-Sterling. 2016. “Beyond Sex Differences: New Approaches for Thinking about Variation in Brain Structure and Function.” Philosophical Transactions of the Royal Society of London series B, Biological Sciences 371 (1688). rstb.royalsocietypublishing.org: 20150451.
Joel, Daphna, and Margaret M. McCarthy. 2017. “Incorporating Sex as a Biological Variable in Neuropsychiatric Research: Where Are We Now and Where Should We Be?” Neuropsychopharmacology: Official Publication of the American College of Neuropsychopharmacology 42, no. 2: 379.
Joel D., Persico A., Salhov M., Berman Z., Oligschläger S., Meilijson I., Averbuch A. (2018). Analysis of Human Brain Structure Reveals that the Brain “Types” Typical of Males Are Also Typical of Females, and Vice Versa. Front Hum Neurosci., 12: 399.
Jordan-Young, Rebecca M. 2010. Brain Storm. Harvard University Press.
–. 2014. “Fragments for the Future.” Gendered Neurocultures: Feminist and Queer Perspectives on Current Brain Discourses, 375–91. Zaglossus Vienna.
Kaiser, Anelis. 2012. “Re-conceptualizing ‘Sex’ and ‘Gender’ in the Human Brain.” Zeitschrift Für Psychologie 220, no. 2: 130–6. econtent.hogrefe.com.
Kaiser, Anelis, Sven Haller, Sigrid Schmitz, and Cordula Nitsch. 2009. “On Sex/Gender Related Similarities and Differences in fMRI Language Research.” Brain Research Reviews 61, no. 2: 49–59. Elsevier.
Khemlani, Sangeet, Sarah-Jane Leslie, and Sam Glucksberg. 2012. “Inferences about Members of Kinds: The Generics Hypothesis.” Language and Cognitive Processes 27, no. 6: 887–900. Routledge.
Kuria, Emily Ngubia. 2012. “Experimenting with Gender: How Science Constructs Difference.” International Journal of Gender, Science and Technology 4, no. 1: 48–61. genderandset.open.ac.uk.
Kurth, Florian, Lutz Jancke, and Eileen Luders. 2017. “Sexual Dimorphism of Broca’s Region: More Gray Matter in Female Brains in Brodmann Areas 44 and 45.” Journal of Neuroscience Research 95, no. 1–2: 626–32. Wiley.
Leonard, Christiana M., Stephen Towler, Suzanne Welcome, Laura K. Halderman, Ron Otto, Mark A. Eckert, and Christine Chiarello. 2008. “Size Matters: Cerebral Volume Influences Sex Differences in Neuroanatomy.” Cerebral Cortex 18, no. 12: 2920–31. academic.oup.com.
Linden, Dimitri van der, Curtis S. Dunkel, and Guy Madison. 2017. “Sex Differences in Brain Size and General Intelligence (g).” Intelligence 63 (July): 78–88. Elsevier.
Livingston, R.B. 1966. “Brain Mechanisms in Conditioning and Learning.” Neurosciences Research Program Bulletin 4, no. 3: 349–54.
Longino, Helen E. 1987. “Can There Be a Feminist Science?” Hypatia 2, no. 3: 51–64. Wiley.
Maney, Donna L. 2016. “Perils and Pitfalls of Reporting Sex Differences.” Philosophical Transactions of the Royal Society of London series B, Biological Sciences 371 (1688). rstb.royalsocietypublishing.org: 20150119.
Martínez, Kenia, Joost Janssen, José Ángel Pineda-Pardo, Susanna Carmona, Francisco Javier Román, Yasser Alemán-Gómez, David Garcia-Garcia, et al. 2017. “Individual Differences in the Dominance of Interhemispheric Connections Predict Cognitive Ability beyond Sex and Brain Size.” NeuroImage 155 (July): 234–44. Elsevier.
Marwha, Dhruv, Meha Halari, and Lise Eliot. 2017. “Meta-Analysis Reveals a Lack of Sexual Dimorphism in Human Amygdala Volume.” NeuroImage 147 (February): 282–94. Elsevier.
Mori, Susumu, Setsu Wakana, Peter C.M. Van Zijl, and L.M. Nagae-Poetscher. 2005. MRI Atlas of Human White Matter. Elsevier.
Nelson, Julie A. 2015. “Are Women Really More Risk-Averse than Men? A Re-analysis of the Literature Using Expanded Methods.” Journal of Economic Surveys 29, no. 3: 566–85. Wiley.
Nettleton, D., and R.W. Doerge. 2000. “Accounting for Variability in the Use of Permutation Testing to Detect Quantitative Trait Loci.” Biometrics 56, no. 1: 52–8. Wiley.
Nichols, Thomas E., and Andrew P. Holmes. 2002. “Nonparametric Permutation Tests for Functional Neuroimaging: A Primer with Examples.” Human Brain Mapping 15, no. 1: 1–25. Wiley.
Nopoulos, P., M. Flaum, D. O’Leary, and N.C. Andreasen. 2000. “Sexual Dimorphism in the Human Brain: Evaluation of Tissue Volume, Tissue Composition and Surface Anatomy Using Magnetic Resonance Imaging.” Psychiatry Research 98, no. 1: 1–13. Elsevier.
Pardue, M.L., and T.M. Wizemann. 2001. “Exploring the Biological Contributions to Human Health: Does Sex Matter?” Journal of Women’s Health & Gender-Based Medicine 10, no. 5: 433–9.
Parker, Geoffrey J.M., Simona Luzzi, Daniel C. Alexander, Claudia A.M. Wheeler-Kingshott, Olga Ciccarelli, and Matthew A. Lambon Ralph. 2005. “Lateralization of Ventral and Dorsal Auditory-Language Pathways in the Human Brain.” NeuroImage 24, no. 3: 656–66. Elsevier.
Pesarin, Fortunato, and Luigi Salmaso. 2012. “A Review and Some New Results on Permutation Testing for Multivariate Problems.” Statistics and Computing 22, no. 2: 639–46. Springer.
Plante, Elena, Vince J. Schmithorst, Scott K. Holland, and Anna W. Byars. 2006. “Sex Differences in the Activation of Language Cortex during Childhood.” Neuropsychologia 44, no. 7: 1210–21. Elsevier.
Prager, Eric M. 2017. “Addressing Sex as a Biological Variable.” Journal of Neuroscience Research 95, no. 1–2: 11. Wiley.
Rametti, Giuseppina, Beatriz Carrillo, Esther Gómez-Gil, Carme Junque, Santiago Segovia, Ángel Gomez, and Antonio Guillamon. 2011. “White Matter Microstructure in Female to Male Transsexuals before Cross-Sex Hormonal Treatment: A Diffusion Tensor Imaging Study.” Journal of Psychiatric Research 45, no. 2: 199–204. Elsevier.
Random.org. “Randomness and Integrity Services Ltd. c1998–2017.” www.random.org.
Rippon, Gina, Rebecca Jordan-Young, Anelis Kaiser, and Cordelia Fine. 2014. “Recommendations for Sex/Gender Neuroimaging Research: Key Principles and Implications for Research Design, Analysis, and Interpretation.” Frontiers in Human Neuroscience 8 (August): 650. ncbi.nlm.nih.gov.
Rippon, Gina, Rebecca Jordan-Young, Anelis Kaiser, Daphna Joel, and Cordelia Fine. 2017. “Journal of Neuroscience Research Policy on Addressing Sex as a Biological Variable: Comments, Clarifications, and Elaborations.” Journal of Neuroscience Research 95, no. 7: 1357–59. Wiley
Roy, Deboleena. 2008. “Asking Different Questions: Feminist Practices for the Natural Sciences.” Hypatia 23, no. 4: 134–56. Wiley.
–. 2012. “Neuroethics, Gender and the Response to Difference.” Neuroethics 5, no. 3: 217–30. Springer Netherlands.
Saur, Dorothee, Björn W. Kreher, Susanne Schnell, Dorothee Kümmerer, Philipp Kellmeyer, Magnus-Sebastian Vry, Roza Umarova, et al. 2008. “Ventral and Dorsal Pathways for Language.” Proceedings of the National Academy of Sciences of the United States of America 105, no. 46. National Acad Sciences: 18035–40.
Schellenberg, D., and A. Kaiser. 2017. “The Sex/Gender Distinction: Beyond F and M.” In APA Handbook of the Psychology of Women, edited by C.B. Travis, J.W. White, A. Rutherford, and W.S. Williams, 165–87.
Schmitz, Sigrid, and Grit Höppner. 2014. “Neurofeminism and Feminist Neurosciences: A Critical Review of Contemporary Brain Research.” Frontiers in Human Neuroscience 8 (July): 546. frontiersin.org.
Shaywitz, B.A., S.E. Shaywitz, K.R. Pugh, R.T. Constable, P. Skudlarski, R.K. Fulbright, R.A. Bronen, J.M. Fletcher, D.P. Shankweiler, and L. Katz. 1995. “Sex Differences in the Functional Organization of the Brain for Language.” Nature 373 (6515): 607–9.
Shields, P.G. 2000. “Publication Bias Is a Scientific Problem with Adverse Ethical Outcomes: The Case for a Section for Null Results.” Cancer Epidemiology, Biomarkers & Prevention: A Publication of the American Association for Cancer Research, cosponsored by the American Society of Preventive Oncology 9, no. 8: 771–2.
Shiino, Akihiko, Yen-Wei Chen, Kenji Tanigaki, Atsushi Yamada, Piers Vigers, Toshiyuki Watanabe, Ikuo Tooyama, and Ichiro Akiguchi. 2017. “Sex-Related Difference in Human White Matter Volumes Studied: Inspection of the Corpus Callosum and Other White Matter by VBM.” Scientific Reports 7 (January): 39818.
Shors, T.J., C. Chua, and J. Falduto. 2001. “Sex Differences and Opposite Effects of Stress on Dendritic Spine Density in the Male versus Female Hippocampus.” The Journal of Neuroscience 21, no. 16. Soc Neuroscience: 6292–7.
Smith, Stephen M., Mark Jenkinson, Heidi Johansen-Berg, Daniel Rueckert, Thomas E. Nichols, Clare E. Mackay, Kate E. Watkins, et al. 2006. “Tract-Based Spatial Statistics: Voxelwise Analysis of Multi-Subject Diffusion Data.” NeuroImage 31, no. 4: 1487–505. Elsevier.
Sommer, Iris E., André Aleman, Metten Somers, Marco P. Boks, and René S. Kahn. 2008. “Sex Differences in Handedness, Asymmetry of the Planum Temporale and Functional Language Lateralization.” Brain Research 1206 (April): 76–88. Elsevier.
Sommer, Iris E.C., André Aleman, Anke Bouma, and René S. Kahn. 2004. “Do Women Really Have More Bilateral Language Representation than Men? A Meta-Analysis of Functional Imaging Studies.” Brain: A Journal of Neurology 127 (part 8): 1845–52. academic.oup.com.
Sotiropoulos, S.N., S. Moeller, S. Jbabdi, J. Xu, J.L. Andersson, E.J. Auerbach, E. Yacoub, et al. 2013. “Effects of Image Reconstruction on Fiber Orientation Mapping from Multichannel Diffusion MRI: Reducing the Noise Floor Using SENSE.” Magnetic Resonance in Medicine: Official Journal of the Society of Magnetic Resonance in Medicine / Society of Magnetic Resonance in Medicine 70, no. 6: 1682–9. Wiley.
Springer, Kristen W., Jeanne Mager Stellman, and Rebecca M. Jordan-Young. 2012. “Beyond a Catalogue of Differences: A Theoretical Frame and Good Practice Guidelines for Researching Sex/Gender in Human Health.” Social Science & Medicine 74, no. 11: 1817–24. Elsevier.
Sullivan, Gail M., and Richard Feinn. 2012. “Using Effect Size – or Why the P Value Is Not Enough.” Journal of Graduate Medical Education 4, no. 3: 279–82.
Szeszko, Philip R., Joshua Vogel, Manzar Ashtari, Anil K. Malhotra, John Bates, John M. Kane, Robert M. Bilder, Theresa Frevert, and Kelvin Lim. 2003. “Sex Differences in Frontal Lobe White Matter Microstructure: A DTI Study.” Neuroreport 14, no. 18: 2469–73. journals.lww.com.
Tan, Anh, Wenli Ma, Amit Vira, Dhruv Marwha, and Lise Eliot. 2016. “The Human Hippocampus Is Not Sexually-Dimorphic: Meta-Analysis of Structural MRI Volumes.” NeuroImage 124 (part A): 350–66. Elsevier.
Tunç, Birkan, Berkan Solmaz, Drew Parker, Theodore D. Satterthwaite, Mark A. Elliott, Monica E. Calkins, Kosha Ruparel, Raquel E. Gur, Ruben C. Gur, and Ragini Verma. 2016. “Establishing a Link between Sex-Related Differences in the Structural Connectome and Behaviour.” Philosophical Transactions of the Royal Society of London series B, Biological Sciences 371 (1688). rstb.royalsocietypublishing.org: 20150111.
Van Essen, David C., Stephen M. Smith, Deanna M. Barch, Timothy E.J. Behrens, Essa Yacoub, Kamil Ugurbil, and WU-Minn HCP Consortium. 2013. “The WU-Minn Human Connectome Project: An Overview.” NeuroImage 80 (October): 62–79.
van Anders, S. & Watson, N. (2006). Social neuroendocrinology: Effects of social contexts and behaviors on sex steroids in humans. Volume 17, Issue 2, pp 212–237.
Vawter, Marquis P., Simon Evans, Prabhakara Choudary, Hiroaki Tomita, Jim Meador-Woodruff, Margherita Molnar, Jun Li, et al. 2004. “Gender-Specific Gene Expression in Post-Mortem Human Brain: Localization to Sex Chromosomes.” Neuropsychopharmacology: Official Publication of the American College of Neuropsychopharmacology 29, no. 2: 373–84. ncbi.nlm.nih.gov.
Vidal, C., and J. Marchant. 2016. “Practical Guidelines for the Consideration of the Link between Sex and Gender in Medical Research and Health.” Neuroimaging. INSERM.
Wallentin, Mikkel. 2009. “Putative Sex Differences in Verbal Abilities and Language Cortex: A Critical Review.” Brain and Language 108, no. 3: 175–83. Elsevier.
Weitzman, Murray S. 1970. Measures of Overlap of Income Distributions of White and Negro Families in the United States. Vol. 22. US Bureau of the Census.
Wilkinson, Leland. 1999. “Statistical Methods in Psychology Journals: Guidelines and Explanations.” The American Psychologist 54, no. 8: 594.
Wong, Francis C.K., Bharath Chandrasekaran, Kyla Garibaldi, and Patrick C.M. Wong. 2011. “White Matter Anisotropy in the Ventral Language Pathway Predicts Sound-to-Word Learning Success.” The Journal of Neuroscience 31, no. 24: 8780–5.
Zatorre, Robert J., R. Douglas Fields, and Heidi Johansen-Berg. 2012. “Plasticity in Gray and White: Neuroimaging Changes in Brain Structure during Learning.” Nature Neuroscience 15, no. 4: 528–36. ncbi.nlm.nih.gov.
- In this paper, we take the perspective that, due to the entanglement of biological and environmental factors in any neural phenotype, it is analytically not possible to completely distinguish between “sex” and “gender” and we have to use the term “sex/gender” (Kaiser 2012). We have retained the expression “sex differences” when it refers to other authors’ wording in their works.[↑]
- The authors are listed alphabetically; they contributed equally to this paper and are all first authors. Data were provided (in part) by the Human Connectome Project, WU-Minn Consortium (Principal Investigators: David Van Essen and Kamil Ugurbil; 1U54MH091657) funded by the sixteen NIH institutes and centers that support the NIH Blueprint for Neuroscience Research; and by the McDonnell Center for Systems Neuroscience at Washington University. We thank the two anonymous reviewers for their thoughtful comments that help to improve the manuscript substantially.[↑]
- Eric Prager, personal communication to Giordana Grossi, 16 October 2017. For a constructive commentary on the editorial policy, which did not put out an open call, see Rippon et al. 2017.[↑]
- While “sex” is often considered an independent variable, sex/gender can be characterized as an outcome variable, the result of an ongoing developmental process.[↑]
- Tan et al. (2016, 357–8) also discuss how different types of adjustments of hippocampal volume change the direction and size of sex differences.[↑]
- We can transform the r2 into Cohen’s d (0.06; d=2r/√(1-r2); a quicker approximation can be used, d=2r (Hyde 2014).[↑]
- Weitzman’s ∆ = ∫ min f1(x), f2(x) dx[↑]
- Data are generally collected with an assumption of two sex/gender groups, so while gender is more complicated and expansive than this, secondary analyses are constrained by this initial collection and labeling.[↑]
- The Human Connectome Project (humanconnectomeproject.org) is a multi-institution long-term project funded by the National Institutes of Health in the United States that aims to collect and share a large repository of structural and functional neural connectivity data in human subjects. Although the project’s explicit goals are to create a neural connectivity map, the actual data within the repository are composed of hundreds of scans of individual human subjects.[↑]
- Of the seventy-seven individuals (forty-one women, thirty-six men), seventy-six were between the ages of twenty-two and thirty-six; one individual was listed in the dataset as “36+”. These ages are comparable to one described in the Kurth et al. (2017) study, in which the authors examined one hundred men and women with a mean age of forty-five from a publicly available database (International Consortium for Brain Mapping; ).[↑]
- FA is the term used for the direction and magnitude of diffusion at each voxel, or three-dimensional pixel, within a scanned brain. Larger FA values indicate greater magnitude and unidirectionality of fluid movement.[↑]
- TBSS aligns FA data from individual scans with each other in the data set using nonlinear registration. For analysis, individual scan data are projected onto an alignment-invariant reconstruction of the mean FA skeleton generated by the software. FSL is a comprehensive library of analysis tools for brain imaging data; https://fsl.fmrib.ox.ac.uk/fsl/fslwiki.[↑]
- Statistics were run on a voxel-by-voxel basis (known as voxelwise statistics) using FEAT, part of the FSL toolkit.[↑]
- Anatomical landmarks for the ROI were based on a previously constructed white matter tractography atlas for FSL (Mori et al. 2005; Hua et al. 2008).[↑]
- ROIs were drawn on white matter within BA44 and BA45, on the averaged FA template using coordinates from the Harvard-Oxford Human Brain Atlas (Desikan et al. 2006; Bakker, Tiesinga, and Köttner 2015). In order to standardize the demarcation between white matter and grey matter voxels, a voxel intensity threshold of 3,000 was chosen.[↑]
- To obtain FA values for each individual within Broca’s area, this ROI was projected back into native space for each subject (Smith et al. 2006). [↑]
- Recent work has focused on the languages used in sex/gender difference research. For example, Khemlani et al. (2012) argue that sentences such as “men have a higher x than women” are misleading because they are understood as confirming a (categorical) sex/gender difference at the individual level. This assumption harbors the risk of stereotyping, as Nelson (2013) shows. She explains detected aggregate difference (group differences) cannot be used to conclude what a randomly chosen pairwise comparison would reveal: “Cases of xMi – xWi < 0 (that is, ‘this individual woman has a higher x than this individual man’) would generally exist among random pairings at the individual level, even though xM – xW > 0 (men’s average is higher), and statistically significantly so” (Nelson 2013, 3). Often, the sex/gender of an individual women or men is taken to demonstrate their relative amount of x, and this exactly correspond to the process of stereotyping: an (inaccurate) idea people have about a person based on that person’s gender.[↑]
- E.g., how to adjust brain regions’ volumes in structural MRI studies or how to measure lateralization of functions (Ihnen et al. 2009; Kaiser et al. 2009).[↑]